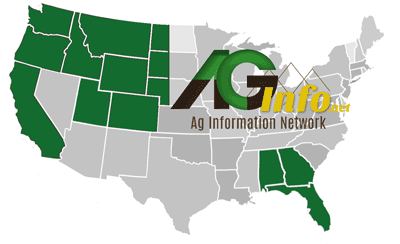
State Rankings of ARC and PLC Payments
Several ag Mid-West ag economists created a map with the percentage of payments received from ARC/PLC for 2014-15 relative to the average direct payments received from 2010 to 2013. The percentages do vary from region to region. CliftonLarsonAllen Principle and Farm CPA Today blogger Paul Neiffer starts by saying Washington State faired pretty well with 157 percent compared to the average.Neiffer: "That is primarily due to the large corn ARC payments, plus the large wheat ARC payments that were received in 2014 and 2015. Now for 2016 which is going to be received in 2017 likely that number will trend down a little bit. Oregon was about flat it was at 105 percent compared to the previous average. Idaho was quite a bit under. It was 73 percent. Again for this current crop the 2016 crop paid in 2017 there is going to be a very large wheat PLC payment. I would guess that Idaho would actually go above average because I would expect most of those wheat growers —- especially in the southeastern part of the state — elected to have PLC. Those payments in some those areas could be as high $200 per acre. Colorado is slightly above there are at 111 percent.
To read more of Neiffer's informative blog — go to farmcpatoday.com
