Oregon Ag Changes
Something states from Colorado to the whole Northwest might learn from Oregon. After falling from the top perch of Oregon agriculture for the past two years, greenhouse and nursery products have recaptured the number one position among Oregon's diverse agricultural commodities in terms of production value. Cattle and calves have returned to runner-up status after a couple of strong years while the rest of Oregon ag's top ten list contains the same names as last year with a slightly altered order.
Newly released statistics from USDA's National Agricultural Statistics Service (NASS) provides a preliminary picture of 2016's crop, livestock, and fisheries value of production.
With Oregon producing more than 220 commodities as part of its agriculture and fisheries, there will always be some winners and some losers any given year. Last year's results show that a majority of the state's leading agricultural sectors grew a bit although a handful saw a decrease. The value of production in Oregon last year includes a top ten list that reflects the new leader:
(1) Greenhouse and nursery products, $909 million
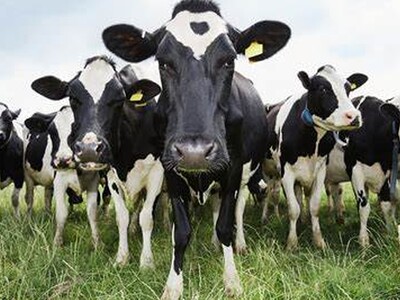
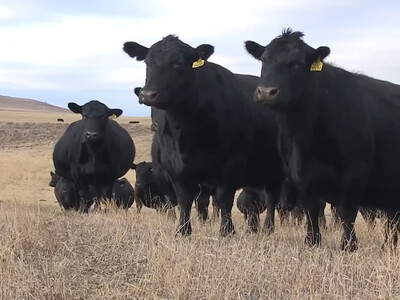
(2) Cattle and calves, $701 million
(3) Hay, $661 million
(4) Milk, $469 million
(5) Grass seed, $436 million
(6) Potatoes, $187 million
(7) Wheat, $185 million
(8) Pears, $181 million
(9) Wine grapes, $143 million
(10) Onions, $125 million
In addition to greenhouse and nursery products swapping places with cattle and calves from the previous year's list, potatoes and wheat exchanged positions in the top ten at #6 and #7 respectively. Oregon has 12 agricultural commodities exceeding $100 million in production value. Hazelnuts ($118 million) and blueberries ($104 million) just missed the top ten list.
The change at the top was not unexpected. The cattle industry tends to be cyclical and the strong prices enjoyed in 2014 and 2015 weakened last year. The result was a 23 percent drop in production value. Meanwhile, the greenhouse and nursery industry continues its slow but steady recovery from the nation's economic recession shortly after the sector topped the billion dollar mark in 2007. Last year's production value grew nearly 2 percent from 2015.
Other top ten commodities that enjoyed increases in production value last year are pears (+19 percent), grass seed (+14 percent), hay (+9 percent), and potatoes (+6 percent). In addition to cattle and calves, top ten commodities that showed a decrease in production value last year are wheat (-15 percent), wine grapes (-3 percent), and milk (-1 percent). The production value for onions has remained virtually the same.
Expanding the list of commodities in Oregon, a new crop has cracked the top twenty. Hops, boosted by the meteoric growth of craft brewing and strong prices last year, now sits at #15 with a production value of $65 million, nearly a 100 percent increase from 2015. Corn for grain is another new entry to this year's list.
Rounding out the top twenty ag and fisheries commodities by value of production:
(11) Hazelnuts, $118 million
(12) Blueberries, $104 million
(13) Christmas trees, $90 million
(14) Cherries, $79 million
(15) Hops, $65 million
(16) Apples, $59 million
(17) Dungeness crab, $55 million
(18) Eggs, $42 million
(19) Mint for oil, $41 million
(20) Corn for grain, $38 million
There were some dramatic shifts among this group of commodities last year. On the positive side, Dungeness crab (+66 percent), hazelnuts (+37 percent), apples (+34 percent), and cherries (+16 percent) showed strong growth. On the down side, eggs saw a huge drop of 64 percent, while Christmas trees (-27 percent) and mint (-21 percent) also recorded production value decreases. Blueberries remained virtually the same in 2016.
The preliminary 2016 statistics also show a slight drop in the number of farms in Oregon, now at 34,400, an in total acreage of land in farms, now at 16,300,000. Included in the numbers is a list of commodities in which Oregon is the nation's leading producer– Christmas trees, hazelnuts, grass seed, blackberries, Boysenberries, rhubarb, sugarbeet seed, and potted florist azaleas. Oregon ranks second in production of pears, blueberries, sweet cherries, black raspberries, hops, peppermint, and snap beans.
Once again, Oregon's agricultural diversity protects the overall industry. Whereas Midwest states may rely on just two or three commodities, Oregon boasts 17 that have a value of at least $50 million.
When 2017 statistics are tabulated, expect to see most of the same names in the top twenty agricultural and fisheries commodities– with perhaps a couple of surprises.